Overview
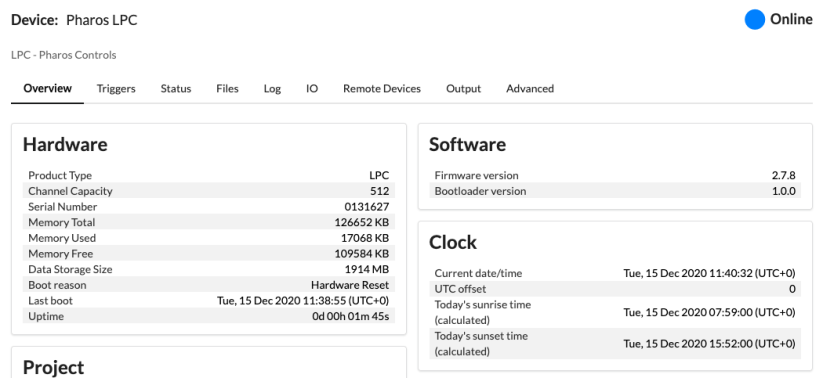
Displays information about the controller such as Hardware and Software information, temperatures, Network settings, Time / Date settings and Project details. Some controllers will have slightly different Overview information depending on what the specific controller type supports.
Occasionally in this tab a table row will highlight blue. This means that this information has just been updated by the controller. Hovering over a table row will provide a tool tip as to when that information was last updated by the controller. Uptime and Current date/time are updated by the controller roughly every 10 seconds with Pharos Cloud increasing the value every second between controller updates.
